categories
latest news
  • SPIE PHOTONICS WEST 2023

    Invitation for the Photonics West 2023 WTS would attend the USA Photonics West 2023 at booth #5533 Jan 31th to Feb 2nd 2023  Welco...

  • CIOE 2021 Shenzhen

    China International Optoelectronic Expo CIOE 2021 Time: Sep 16th-18th 2021 Add: ShenZhen World Exhibition & Convention Center Booth Number: #5A75 ...

  • Work together, Fight with COVID 2019

    WORKING TOGETHER, FIGHTING WITH COVID 2019 Dear Customer, Partners and Colleagues, In 2020, we spent the longest and most memorable Spring Festival in...

  • Happy 2020 Chinese Rat Year

    Happy 2020 Chinese Rat Year   At 6:00 pm on January 10, 2020, the Fuzhou WTS Photonics 2019 End of the Year Party was kicked off at the Hyat...
view more news
Optical Windows
How does Opticstudio sample in wavefront calculation
Jun 22, 2018
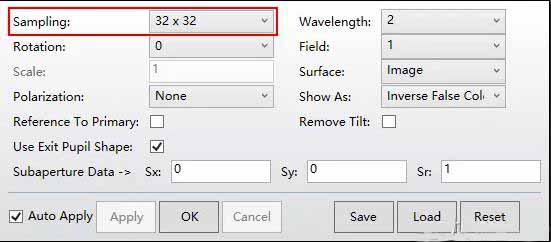
How to sample in Wavefront based analysis and calculation, including Wavefront Map, point spread function (PSF) and modulation transfer function (MTF).

Question:
Where is the center of the sampling grid in the wavefront graph and other correlation analysis?
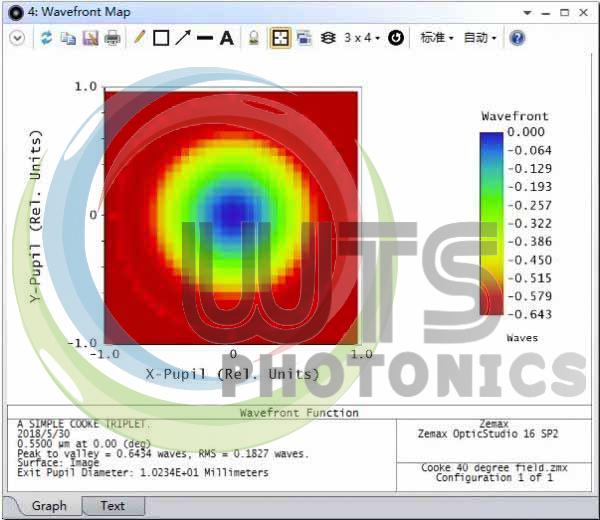
First of all, we observe the wavefront figure, wavefront data is the foundation of many other OpticStudio analysis functions, such as PSF, MTF and circle into Energy (Encircled Energy).

When doing numerical calculations, we want to maintain the symmetry of the pupil and keep the position of the main light at an actual point in the middle of the beam.Also, we need to determine a central point for the FFT algorithm.In order to fulfill these requirements, we need to define the center of the pupil in the pupil space (called by different definitions the near field or space field), namely (n/2+1,n/2+1).So when you look closely at the wavefront diagram you see that the data in the leftmost column is all zero.

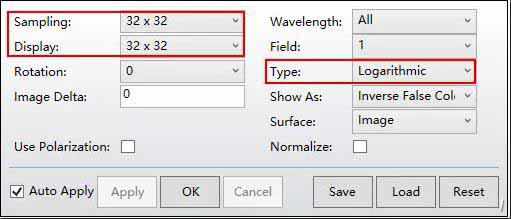
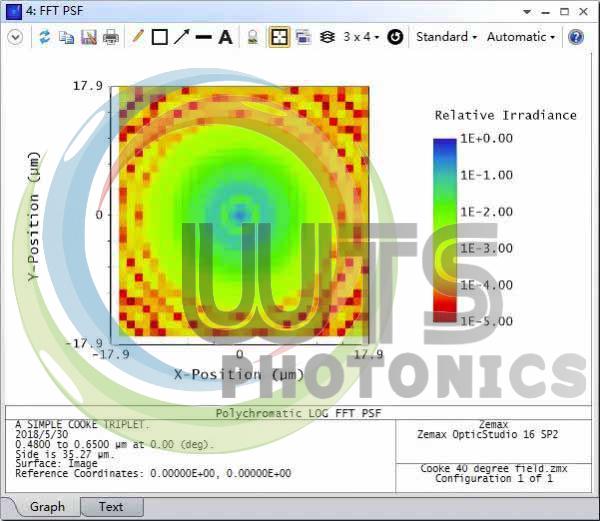
So let's look at the PSF analysis.PSF is the result of the wavefront square after the fast Fourier transform.The FFT PSF

We can see that the PSF is centered around the pixel in (n/2,n/2), which is the pixel in (16,16).This is related to the way FFT is calculated and the definition of direction in OpticStudio.When the center point of the grid is n/2+1 in one domain (such as the spatial domain), the center point coordinate in another domain (such as the frequency domain) is n/2.A close look at the figure below shows that the data in the left-most column and the bottom row are blank.

In MTF calculation, MTF is the autocorrelation function of wavefront, and the number of pixels is usually twice that of the wavefront graph (regardless of the change of coordinate axis).Therefore, for the sake of MTF, OpticStudio will first supplement 32x32 data points to 64x64 data points with data 0, and then conduct self-correlation calculation.For the 3d FFT MTF (Surface FFT MTF), OpticStudio will square the FFT before the wave, and then calculate its FFT. In other words, MTF is the Fourier transform of PSF.

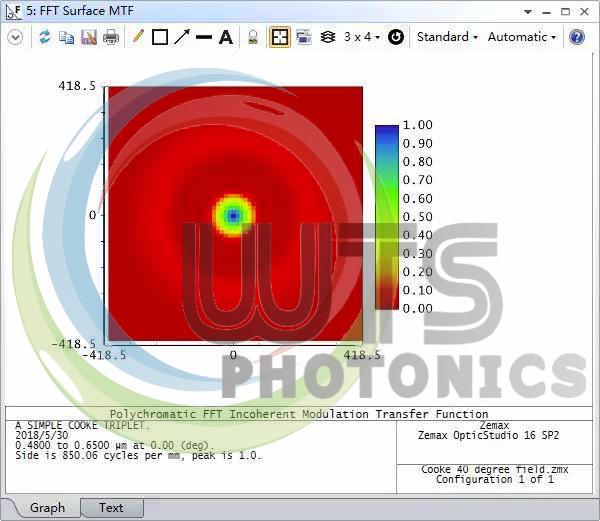
We get the following results:

You can see that the peak point is at the coordinate (32,32), or at (n/2,n/2). OpticStudio determines the frequency interval of 3d FFT MTF by using the boundary of the autocorrelation function 1/(lambda*F/#), where lambda is the shortest wavelength in the system (if we calculate the multi-wavelength result).OpticStudio actually calculates the cutoff frequency of all wavelengths multiplied by the number of F's, and scales the entire chart based on their maximum results.Other wavelengths are scaled in the pupil space to allow all PSF to sample at the same distance.To double cutoff frequency can be the width of the optical transfer function (OTF) (above the graph 850.06 cycles/mm), then the results divided by 2 * n (MTF calculating the number of pixels after zero padding) get sample point spacing.

For example, the width of OTF is 850.06 cycles/mm, and the sampling point is 32x32.So the point spacing is 850.06/64 = 13.282 cycles/mm.The center point of the 3d FFT MTF graph is located at the coordinate (n/2,n/2)=(32,32), and the corresponding frequency is 0 in the graph.In other words, the 32nd column pixel corresponds to a point on the X-axis with a frequency of 0 cycles per mm.Column 33 corresponds to a space frequency of 13.282 cycles/mm, column 34 corresponds to a space frequency of 26.564 cycles/mm, and so on.The last column, column 64, has a corresponding spatial frequency of 32*13.282 = 425.03 cycles/mm.The first column corresponds to a space frequency of -31*13.282 = -411.748 cycles/mm.

As with PSF, 3d FFT MTF charts have left-most column and lower-most behavior white space data.Therefore, the data on the left and right sides of the frequency coordinate axis is not strictly symmetric (the same is true for the top and bottom sides).But keep in mind that each data is symmetric along the "center" of the frequency coordinate system.If you consider a "half-cell pixel" on the left or right (up or down) edge, the entire width is indeed 850.06 cycles per mm.The edge of a finite size pixel covers the entire width, but the central coordinates of each pixel (per column or row) are inserted by half a pixel from each side.

We wholesale a variety of aspherical optical components, including Optical precision glass aspheric lenses,Precision Aspheric Lenses and more.
Subscription

Leave your email, Leave your requirement and then just wait WTS fast response. ;-)

    follow us :

need help

chat now

wts photonics live chat

wts photonics